Support for mainstream network traffic protocols including NetStream, NetFlow, and sFlow.
Customized Dashboard
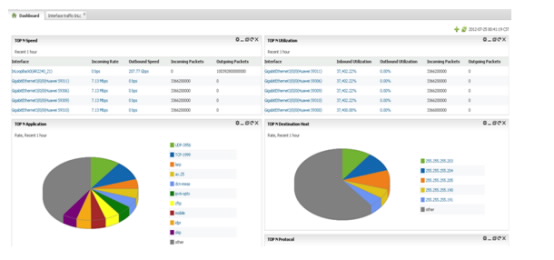
You can customize the dashboard to do the following:
- Rank interface traffic, interface usage, application traffic, protocol traffic, source host traffic, destination host traffic, conversation traffic, and DSCP traffic.
- Display the form, content, and content arrangement, according to your preferences. NTA displays traffic information in wedges on the window. You can refresh a wedge without changing the whole window.
- Summarize interface traffic information, including the input rate, output rate, input packet quantity, and output packet quantity.
- Click a specific interface to learn about the traffic composition of the interface from multiple dimensions such as application, host, conversation, and DSCP within a certain period.
Customizing Traffic Applications and Group Network Traffic
You can customize traffic applications and group network traffic, as follows:
- User-defined applications
- User-defined DSCP group
- User-defined application group
- User-defined IP group or interface group
User-defined Applications
NTA identifies applications based on protocol and port number. NTA presets more than 4500 standard and common Layer 4 applications. For unknown applications, NTA automatically adds the applications based on protocol and port number. Generally, you do not have to add any applications. Network administrators can add applications as needed. You can add applications by choosing the protocol, port range and IP address range. For example, the TCP protocol and port 443 indicate HTTPS applications. If the email system of an enterprise uses port 443, network administrators can create a mail application based on the IP address range of the email system. When receiving TCP/443 packets, the system resolves the data in the IP range to the mail application, and resolves other packets to HTTPS applications.
User-defined DSCP Group
DSCP group is a logical group. You can create a group to differentiate DSCP composition. For example, in WAN QoS monitoring, you can create a voice group (EF), a video group (AF31), and a group of the other DSCP. Therefore, NTA can provide reference for proper QoS bandwidth planning and key services bandwidth of the enterprise.
User-defined Application Group
You can create application groups as needed to obtain comprehensive information of specific applications. For example, you can create an application group named Mail Service, and combine Lotus Notes, pop3, and SMTP applications into the group to learn about the traffic of mail applications.
User-defined IP Group or Interface Group
Consider the IP addresses/interfaces in a certain range as a whole to calculate traffic statistics. For example, an enterprise has two floors. When calculating the total traffic of the enterprise, combine all the switch interfaces on the two floors into an interface group, and analyze the total traffic.
Monitor Multi-dimensional Traffic
Overall network traffic analysis depends on high performance traffic analysis. Network administrators only need to add a monitoring interface and configure the traffic sampling ratio. Then they can monitor and analyze traffic of the interface from multiple dimensions, including the following:
- Interface traffic analysis
- Application traffic analysis
- Source/destination host traffic analysis
- DSCP traffic analysis
- Conversation traffic analysis
Note: You can analyze traffic on the traffic trend diagram, which supports double-axis display: traffic/packets.
Interface Traffic Analysis
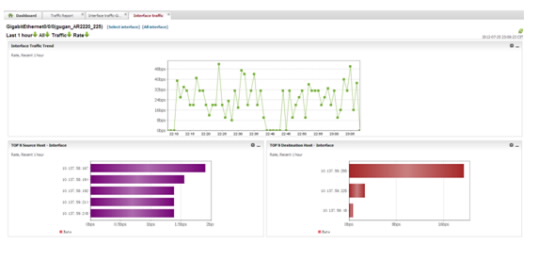
Interface traffic analysis checks the trend of traffic for a specified interface, time range, and incoming/outgoing traffic. Through interface traffic analysis, network administrators can identify the interfaces that are used most often on the network, and this gives them a comprehensive understanding of the whole network status. Administrators can find interfaces with abnormal traffic in time and locate faults before network performance is reduced.
Application Traffic Analysis
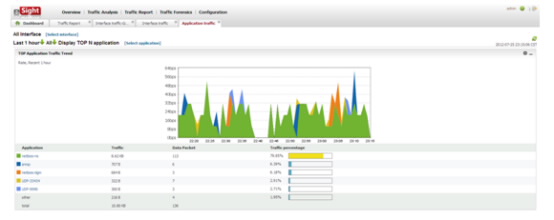
Application traffic analysis checks the trend of application changes for a specified interface, time range, and incoming/outgoing traffic. Administrators can locate the host that causes performance problems based on the ranking of source and destination hosts using a specific application.
Source/Destination Host Traffic Analysis
Source/destination host traffic analysis checks the trend in changes of source/destination host bandwidth usage for a specified interface, time range, and incoming/outgoing traffic. Through source/destination host analysis, network administrators can identify the host that consumes a high bandwidth. Then they can solve any bandwidth problems in time to ensure bandwidth usage efficiency.
Conversation Traffic Analysis
Conversation traffic analysis checks the trend of conversation traffic for a specified interface and time range. It provides detailed conversation information that the network administrator can use for further fault location.
DSCP Traffic Analysis
DSCP traffic analysis checks the trend of DSCP traffic for a specified interface and time range. Therefore, you can plan QoS bandwidth properly to ensure the quality of key services.
Group Traffic Analysis
Group traffic analysis displays the traffic statistics of DSCP group, interface group, application group, and IP group on specified interfaces within specific time range. It is convenient for network administrators to analyze specific traffic as needed to satisfy special maintenance needs.
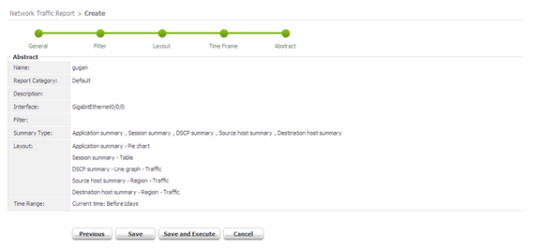
Customized Traffic Report
NTA can customize reports in guide mode by specifying filtering rules, report type and report layout configuration. Traffic reports provide references for further network planning.
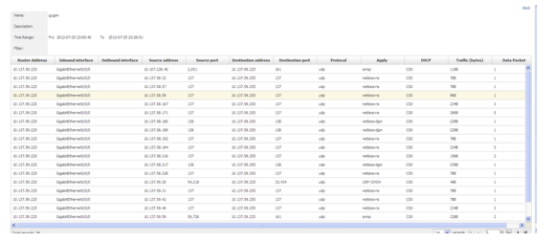
Traffic Auditing
NTA can extract an original data stream according to a specified time range and filtering rules for further analysis and fault location. Original traffic information includes the router address, source address, destination address, application, source port, destination port, protocol, inbound interface, outbound interface, DSCP, traffic, and data packets.
eSight Network Traffic Analyzer can be deployed on the same server as or on different server from eSight Unified Network Management Platform standard or professional edition. Considering the high requirement on server performance in case of huge traffic, you are advised to deploy eSight Network Traffic Analyzer and eSight Unified Network Management Platform on different servers according to the following requirements for running environment.
| Managed Nodes
|
Hardware
|
Operating System
|
Database
|
| 0-100
(0-10000 flows/s)
|
CPU: 1 x quad-core 2 GHz or above
Memory: 4 GB
Disk space: 120 GB
NOTE:
You are advised to use PC servers.
|
Windows Server 2008 R2 standard (64-bit) + MySQL 5.5
Or
Windows Server 2008 R2 standard (64-bit) + Microsoft SQL Server 2008 R2 standard
|
| 100-350
(10000-30000 flows/s)
|
CPU: 2 x quad-core 2 GHz or above
Memory: 16 GB
Disk space: 250 GB
NOTE:
You are advised to use PC servers.
|
When eSight Network Traffic Analyzer and eSight Unified Network Management Platform are deployed on different servers, eSight Network Traffic Analyzer can be deployed on a VM. The resource requirements for the VM are as follows.
| Managed Nodes
|
Resources Required by a VM
|
Operating System
|
Database
|
| 0-100
(0-10000 flows/s)
|
VMWare ESXI 5.0
CPU: 1 x quad-core 2 GHz or above
RAM: 6 GB
Disk space: 300 GB
|
Windows Server 2008 R2 standard (64-bit)
|
Microsoft SQL Server 2008 R2 standard
|
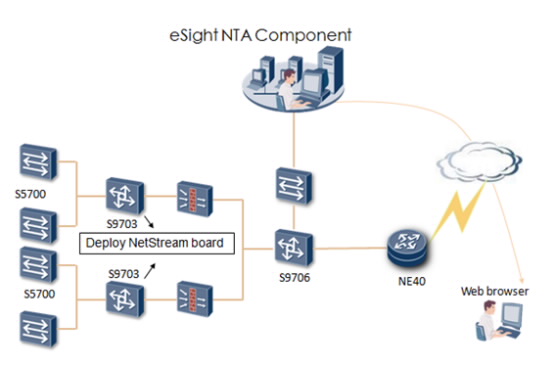
This section describes a typical scenario that uses NTA. The network administrator performs the following actions:
- Deploys a NetStream board on an aggregation switch S9703 to mirror the traffic of the access switches (S5700) on each floor to the NetStream board.
- Configures the S9703 to send traffic information to NTA.
After the network administrator sets up NTA, you can monitor the traffic and traffic composition of each floor. The network administrator can also deploy the NetStream board on the S9706 to monitor the traffic of all core layers. NTA is deployed at the core layer. You can log in NTA through the web browser to check traffic information.